What is Propensity Score Matching and what are the benefits?
What is Proropensity Score Matching?
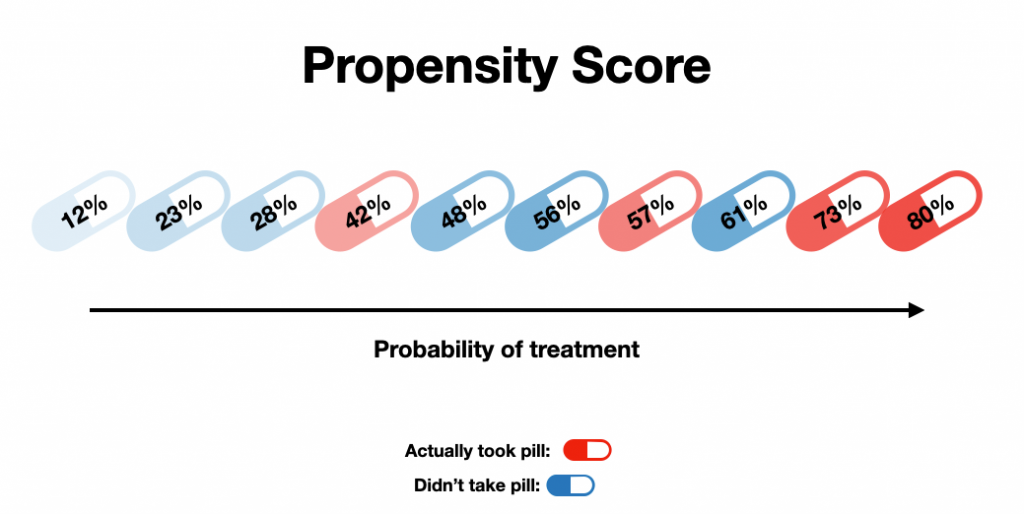
PSM is a statistical matching technique that attempts to estimate the effect of a treatment, policy, or other intervention.
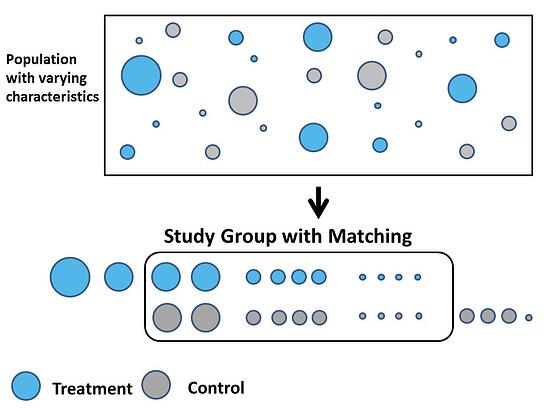
In observational studies, it is common to have confounders, i.e. variables that both affect the outcome and other explanatory variables in the analysis. When comparing, for example, two groups (for instance two different treatments), it is important that the groups are comparable at the start of the analysis. Otherwise, there is a risk that these confounders generate a static relationship between variables without there being direct causal relationships.
The groups are not always comparable and the assignment of treatments to subjects in observational studies are usually not random. With the help of Propensity Score Matching, one can identify imbalances in the data material, evaluate the quality of the matching and estimate the treatment effect.
Who can benefit from using Propensity Score Matching?
Everyone who works with data which originates from observational studies.
When can you benefit from using Propensity Score Matching?
For unbalanced observational data where you want to compare two or more groups based on specific outcomes.